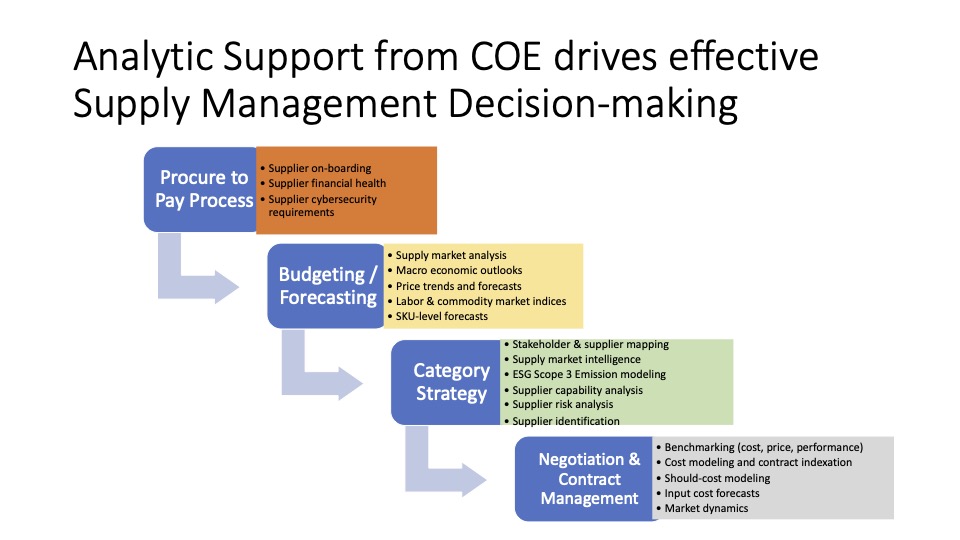
Mapping Your Supplier Network isn’t as Easy as You Think
Supply chains are complex and dynamic networks comprised of supply chain components or nodes. To identify the vulnerabilities in a supply chain network, some form of filter must be applied to “screen” the different potential points that are most likely to experience a critical risk incident. Typically, risk is characterized by both the probability of an event and its severity given that an event occurs. Risks or disruptions in the supply chain are not only increasing in frequency, but the severity of their impact can be costly and potentially bring portions of the supply chain to a complete halt.
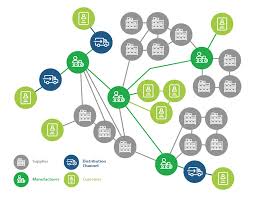
One of the most important tasks identified in managing supply chain risk is a task called “supply chain mapping” or “supplier network mapping”. This task involves identifying all critical supply chain nodes, identifying the location of each supplier factory (not their HQ), and identifying the critical products, components or services that this supplier is responsible for. Many SaaS providers claim to be able to easily perform this task, but m experience is that most do not really have the ability to create a supply chain map that facilitates in-depth understanding of supply chain design and material flow. Once the network is mapped, measuring supply chain risk is a function of measuring the probability of a disruption at nodes where there is significant risk, as well as estimating the severity of the impact on the entire network based on a disruption at a single node. Prior research I worked on with Chris Craighead and Jen Blackhurst in 2007 on supply chain risk proposed that supply chain risk a function of sum or probabilities of disruptions at critical nodes in the network, multiplied by the revenue impact of a disruption in revenue dollars on the end customer. These elements can be broken down further into a set of functions that define these distributions.
Thus, a measurement of supply chain risk as a function of the probability of disruption multiplied by its revenue impact. The probability of an event is a function of the breadth of the supply chain, in terms of the number of global nodes involved as well as the number of constrained dependencies. As the number of leverage points and the lead-time associated with ordering and receiving products from multiple global sources increases, the difficulty of detection and early recovery amplifies the probability of a disruptive event. As the number of constraints (e.g. bottlenecks) in the supply chain from supplier to end customer increases, the difficulty of disruption detection and recovery increases. However, the probability of an event occurring may be reduced by effective supply chain planning and collaboration, quick response for supply chain redesign and information visibility effectiveness. The relative impact of a disruption at a single node is a function of the extent to which the organization has taken preventive measures to reduce the risk through applying excess resources, or the investment in visibility and/or event management systems that alert the company to a disruption. One of the key principles that we emphasize in this perspective is the fact that quick response to a disruption can significantly reduce the impact of the disruption. In this paper, we propose that in situations where a risk is unknown or the impact so great that it cannot be reduced, that the organization consider a significant redesign of its supply chain to start afresh and create a new and robust method of delivering value to the end customer.
A disruption is defined as a major breakdown in a production or distribution nodes that impacts other nodes in the supply chain. Disruptions typically create a bottleneck at one of these nodes that can, in effect, shut down the entire supply chain network. Even small events such as a fire, a machine breakdown, a production quality problem, or a customs delay can cause a major disruption, as well as natural disasters or catastrophic events such as Katrina or 9/11. While disruptions are difficult to predict, they can be planned for, and they can be estimated.
For example, a major automotive company was able to develop a Poisson distribution of the probability of a fire occurring at any major plant. Once established, the plants that had a significantly higher number of fires than the distribution average became candidates for further investigation. To manage the set of disruptions and the entire risk of the network, it is therefore important to begin by not only understanding the probability and impact of supply chain disruptions but also to map all of the nodes of the supply chain, identifying high-risk nodes, measuring the risk at these nodes to better understand disruption impact and nodal relationships (how the supply chain nodes are interconnected).
Ironically, one of the greatest disruptions that occurred in the last two weeks was a major fire at an aluminum supplier to Ford, Toyota, and several other major OEMs. The fire occurred at Novelis’ Oswego plant has halted production of 40% of U.S. automotive aluminum until early 2026. Ford’s F-150 and multiple automakers are at risk of supply disruptions due to the plant outage. Novelis is sourcing aluminum overseas and collaborating with competitors, but the domestic supply is limited. The impact of the fire completely disrupted production for an unknown period. Automakers are only now assessing the impact of the fire and working to mitigate supply disruptions. Ford said it continues to source aluminum from multiple suppliers and has dedicated a team to address the situation. Toyota and Stellantis reported they are adjusting supply chains and working with alternative sources.
But let’s step back or a moment. Creating a supply chain risk plan relies on an accurate and thorough assessment of the not only the “tier 1” suppliers, but indeed tier 2 and tier 3 suppliers. Creating a supply chain risk map with estimates of disruption probabilities and associated revenue impact estimates is a much more difficult exercise than most executives understand. This is because most tier 1 suppliers do not want to share who their tier 2 and tier 3 suppliers are, for fear of being “disintermediated”, meaning that the buyer may go directly to the supplier and by-pass the tier 1 supplier. However, this activity is not impossible, to develop. AI isn’t much help in developing these supply chain maps, because the relationships are always changing, product volumes continually shifting, and impacts on the General Ledger are a moving target. Thus, a focused effort to develop such mapping requires a dedicated Center of Excellence, which focuses on building stronger relationships with suppliers to help them understand that the need for information is not a commercial issue, but a business continuity issue. And this can take years to fully map out one’s supply chain. Someone once told me that a large Korean electronics company set about this task, and after two years working on a supplier map, gave up. The level of complexity is massive. Indeed some of our early work on TSMC, using supplier mapping tools, revealed more than 250,000 suppliers in their network!
Moreover, my discussions with executives on recent SCRC projects found that when a group of executives presented with a nodal structure and an associated set of risk estimates based on solid market intelligence relayed by subject matter experts, that a realistic set of estimated probabilities and “war-gaming” scenarios can be derived. This requires also understanding which critical suppliers to focus on.. By multiplying the probability and revenue impacted at the major nodes in a supply chain, a baseline risk metric can highlight the potential disruptive nodes in the network. Even if conducted on an annual basis, such an exercise can serve as an initial screening mechanism to identify nodes that require the greatest managerial attention to avoid a major disruption. Most importantly, it can identify critical single source or sole source suppliers, and mitigate these issues before they occur.