Is “Price Gouging” by Grocery Stores and Food Producers Really Going On?
It’s election season, and the accusations are flying! The price consumers are paying for food is one of the most controversial issues during this election season. Both sides are making different claims. The Trump campaign claims that inflation has never been higher during the Biden/Harris Administration, and that the federal government is to blame for it. Meanwhile, the Harris Campaign is touting that they will be going after the big companies that are “price gouging” consumers with high prices at the grocery store and ripping off consumers. So who is right?

A recent set of posts on Linked In initiated by Jason Miller, (one of the country’s best government data analysts (in my opinion) Professor at Michigan State), led to some heated debate by readers. With Jason’s permission, I am including a transcript of his analysis, as well as a number of his charts from government sources, that provides a realistic and objective set of insights about the real state of inflation, price gouging, and the role of the government (if any) on these developments. Hopefully these facts will shed some light on a very emotional issue to date in the election campaign cycle.
Are People Paying More for Food?
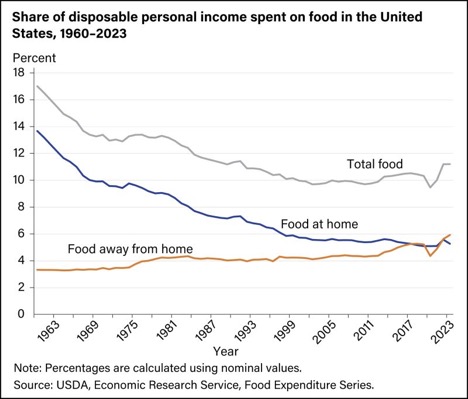
Let’s begin with food. Jason shared a chart created by the USDA that shows the share of disposable personal income being spent on food (both food at home and food away from home).
Several key points to note:
- In 2022 and 2023, the share of disposable income spent on food jumped to 11.2%.
- Eyeballing the chart, this 11.2% figure is the highest percentage since the early 1990s (so roughly 30 years). This helps explain why consumers feel the pinch when at the grocery store or restaurants.
- As can be seen, the 11.2% figure is the highest since the early 1990s. Critically for the price gouging discussion, in 2023, we actually saw consumers’ share of disposable income spent on food at home decline slightly to pre-COVID levels.
- But like always, we need perspective. Back in the 1960s, this expenditure share was above 14%.
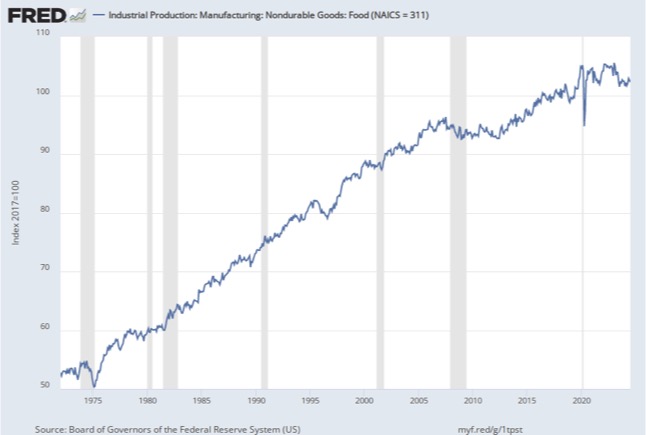
- Also, the comparison of 2022 and 2023 may explain the decline in the industrial production of food that occurred in 2023, shown below. The declining expenditure share for food at home likely corresponds to a net increase in eating out. Restaurants engage in much of the food processing steps that manufacturing plants do for the food at home series (think breading and frying chicken strips). This would reduce the amount of food manufacturing necessary.
What these graphs would seem to imply is that while there is no doubt that Americans are spending more of their income of food than in roughly 30 years, it’s also important to keep the expenditure share in historical perspective. 50 years ago, consumers were spending far more of their paychecks on food.
Why are Food Prices Increasing?
But this then raises the question: why is the price of food going up, given that industrial production of food is not going up? The answer, in a nutshell, is that input prices for food are increasing.
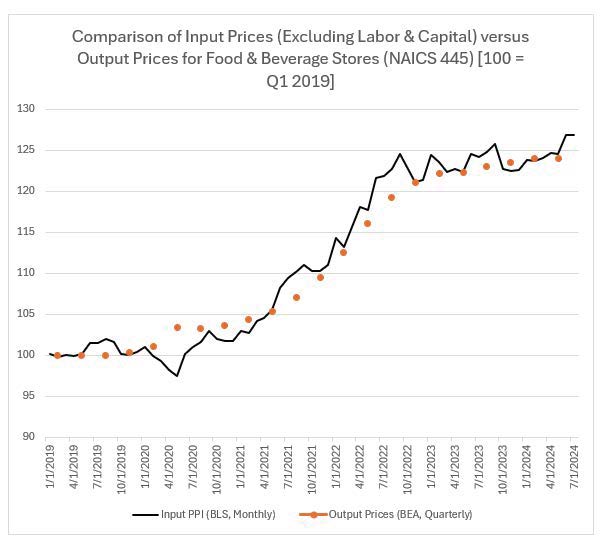
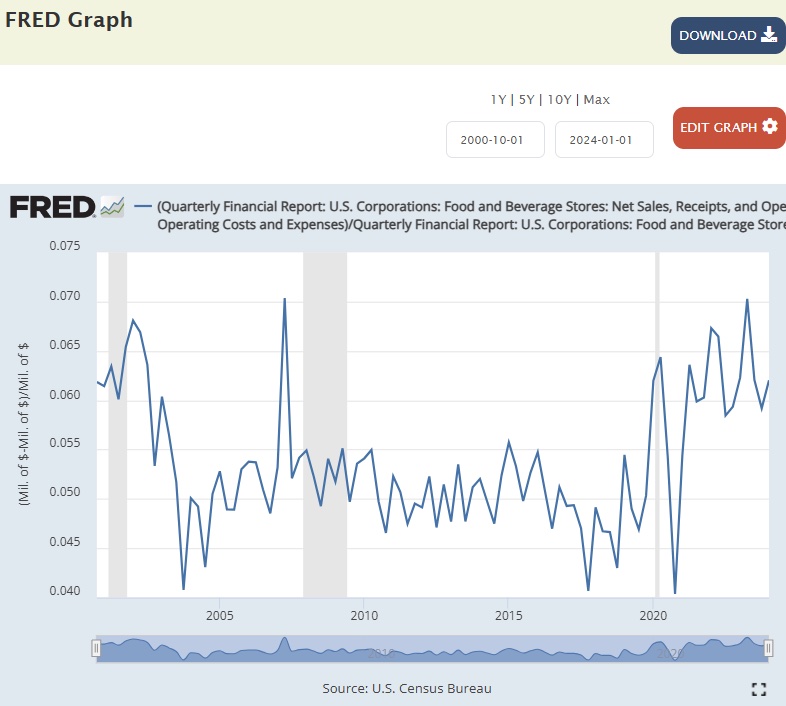
The chart below plots the change in input prices for food and beverage stores, excluding labor and capital, from the Bureau of Labor Statistics Satellite PPIs for inputs to industries data in comparison with the Bureau of Economic Analysis’ Implicit Price Deflator for Food & Beverage Stores (available only quarterly when Jason made the plot because the monthly data were updating the next day).
Note that one observes a near-perfect 1:1 correspondence between the two series, indicating that output prices have risen at the same pace of input prices. This is entirely consistent with cost pass through, not price gouging.
Are Grocery Stores Making Higher Margins?
So are grocery retailers and food producers ‘ margins increasing as food prices have gone up?
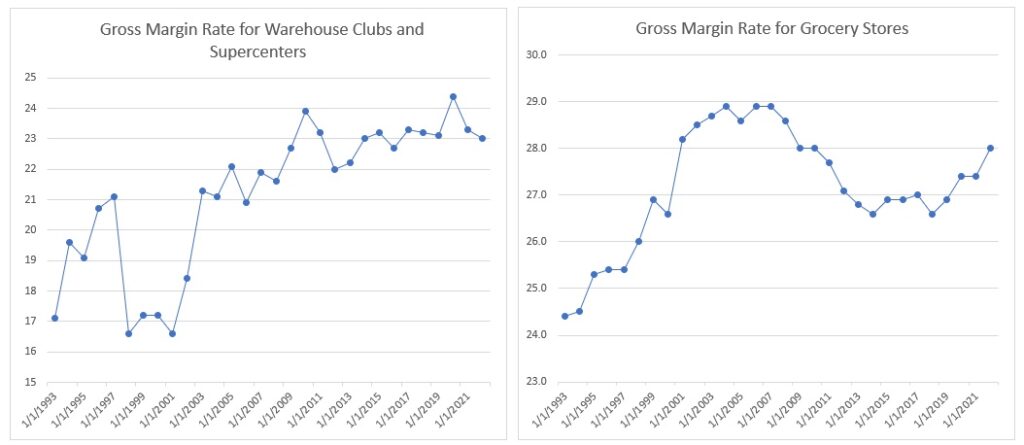
Supporting these data are data from the Census Bureau’s Annual Retail Trade Survey. One table reported from that survey is gross margin rate, which shows how much profit is made per unit sold. The Annual Retail Trade Survey shows the gross margin rates for warehouse clubs & superstores (e.g., Walmart, Target, Costco) were lower in 2021 and 2022 than 2020 (with the 2021 and 2022 figures being right at the 2017-2019 average). Data run through 2022 and available from the Census Bureau website. For grocery stores, gross margin rates were higher in 2022 than prior years, but are a full percentage point below where they were in 2004-2007.
As the ARTS is the most comprehensive source for retail trade data, I would argue this is strong evidence against a price gouging claim by food retailers.
Now, where things get more complex for what the consumer feels is that retailers don’t pass cost increases to consumers on a 1:1 basis. For example, using a 27% gross margin rate for a grocery store, if I have an item that costs $10, I will sell it for ~$13.70 because ($13.70 – $10) / $13.70 = 0.27. Now imagine my costs have increased 25% to $12.50. To maintain that same gross margin rate, I now need to charge $17.12. As such, I increased my price $4.62, not $2.50. So while margins have remained the same, the net margin appears to have increased.
Another factor not considered in these data is the impact of “shrinkflation”. It is difficult to measure the impact of less product for the same cost or more, but this is certainly a factor that is not measured by government data. Also, readers pointed out that transportation costs have stabilized in a time when food costs went up – so what gives? Well, transportation costs represent just 3-6% the value of food shipments, so the inflation in transportation prices had minimal impact on these figures (these percentages are based on the 2017 Commodity Flow Survey).These data are also verified in interviews I’ve had with retail CPG companies, such as Unilever, Procter & Gamble, Heinz-Kraft, Mondelez, PepsiCo and others. CPO’s have uniformly said that there is no way they have been able to offset the increased costs of transportation and raw materials through productivity improvements in their food and CPG processing facilities. They spoke about having “an honest heart to heart” with marketing to let them know that price increases were “inevitable” – which is exactly what happened across the board.
Another factor is the move towards DoorDash and UberEats, which is also boosting the cost of meals, as people don’t want to get off the couch and go grocery shopping! That extra payment for delivery counts into the price of that meal!
What about the claims of “Price Gouging”?
Jason believes that the data that the Harris campaign has been showing are from the Quarterly Financial Report (QFR), and what they have done is take net sales, subtract operating expenses [not including depreciation], and then divide that difference sales (Jason created this chart in FRED, which is shown below). The numbers here seem to align closely (e.g., margins are above 6% today) vs. 5% before COVID). Given the similarities, there are a few issues with using these data to claim that price gouging is occurring.
- One deceiving factor is the “USA Today” factor: the chart shown in many of the Harris campaign ads do not go back to the start of the data in late 2000/early 2001. In fact, margins in this period are exactly where the margin was where it is today.
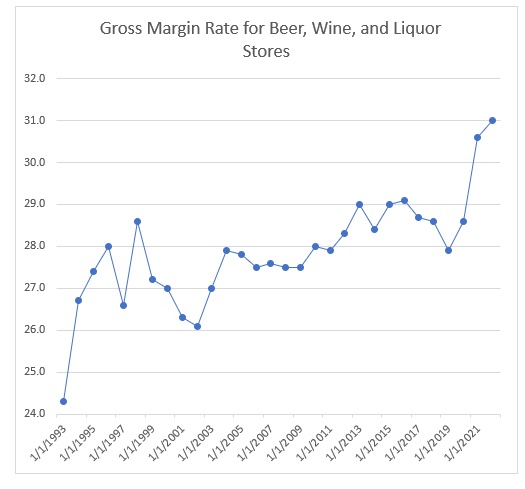
- It is also worthy noting that the FRED data include beverage stores (i.e., alcohol stores). Using the same Annual Retail Trade Survey, we see beer, wine, and liquor stores have a gross margin rate almost two percentage points higher for 2021 and 2022 than pre-COVID. As such, the data being provided to make the case are being shifted upward to a degree based on alcohol sales.
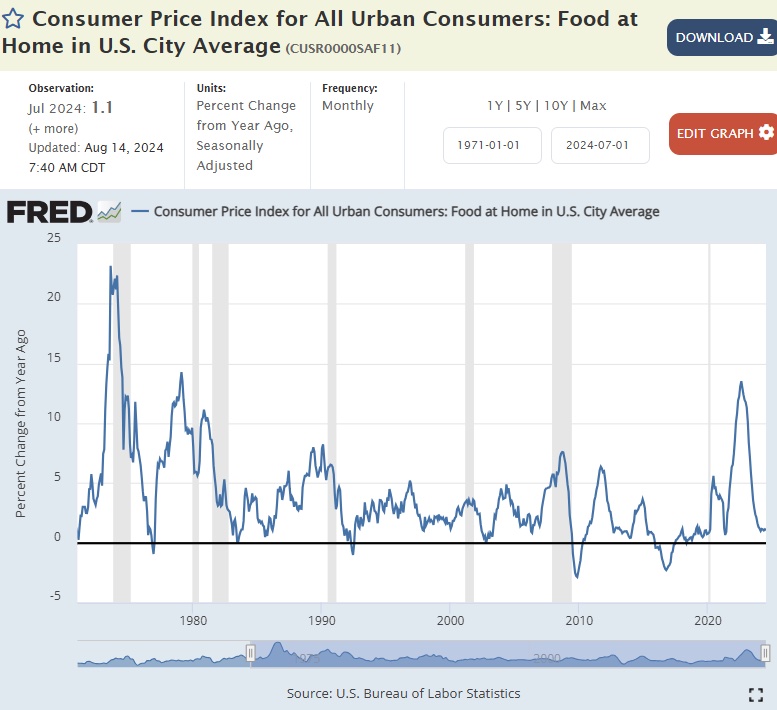
- Looking at food prices for the CPI (for food consumed at home) for July 2024, they are up 1.1% year-over-year. While 2022 saw the sharpest increases since the late 1970s, the fact that inflation has cooled as rapidly as it has in July is inconsistent with a price gouging thesis (e.g., why if grocery stores actually had pricing power would they have let inflation cool this rapidly?)
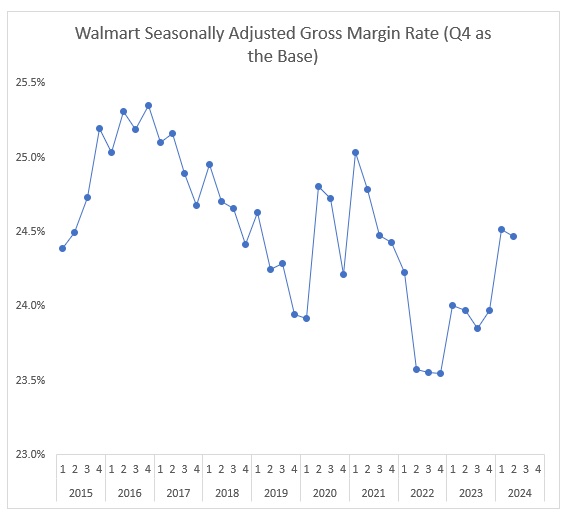
Lastly, Walmart’s data on gross margin rate, calculated as (Revenue – Cost of Goods Sold) / Revenue, is inconsistent with the price gouging thesis. The chart below shows Walmart’s seasonally adjusted gross margin rate. Many of the lowest readings over the past 10 years have come since 2022 (e.g., Q2 2022 – Q4 2022). It’s critical to note that the X-axis represents calendar quarters where we’ve mapped Walmart’s fiscal quarters to the closest calendar quarter (e.g., Q4 2023 represents Walmart’s gross margin rate for the quarter November 2023 – January 2024).
Conclusion: Taken together, these data do not support a price gouging thesis by grocery retailers and food producers, and the Harris administration, if elected, will not be able to “go after” price gougers. Although consumers certainly have suffered as a result of price increases, the normal effects of supply and demand, input commodity prices, and supply chain shortages are the real culprit. It is important to note that the federal government can’t do much about global commodity prices, transportation and labor rates, so blaming the Biden Administration isn’t fair either. And a free market economy is still the best system economists have come up with yet..
- Categories:
- Analytics
- Articles
- Category Management
- Commodities forecasting
- Developing Supply Chain Immunity to Future Shocks
- Director's Blog
- Emerging Issues in Supply Chain
- Food Supply Chains
- Government Acquisition
- Guest Blogs
- Hot Topics
- Impact of Trump on Supply Chain
- Local Food Systems
- Retail Logistics
- Supply Chain Economics