Assessing the True Return of Procurement Transformation on Total Shareholder Return: A Tough Proposition
In my earlier book with Gerard Chick on “The Procurement Value Proposition“, we advance the notion that buildoing a business case for investing in people, process, and technology improvement in procurement is key. Many procurement assessments developed by consultants seek to provide an answer to the question “how far along are you relative to your peers in your procurement transformation journey”, and “which processes are lagging compared to your peers?” This is effectively a “snapshot” in time. While this can be an interesting exercise, it oftens fails to answer the direct of question “how should the procurement process be improved?” and “What is the potential return on investment?”
Procurement assessments can be applied in conjunction with the organization’s strategic plans and business objectives, and thus requires that it be contextualized within the ecosystem and political/business reality of the conditions facing the senior procurement executive within their enterprise. All transformation occurs within the constraints of an organization’s infrastructure (technology, social, managerial, financial, human resources, knowledge management, etc.). These components are not covered in most procurement maturity assessments but are referred to as enabler processes. These may be fleshed out through discussions, interviews, and organization-context specific formats. It is extremely important that these enabler processes be integrated with procurement transformation improvement initiatives in order for successful improvements and to maximize the benefit.
Moreover, a “snapshot” assessment will generally not consider the consistency to which supply chain processes are deployed. It will not determine the extent of deployment across different business units, but could be used to benchmark performance across business units. They may provide specific KPI benchmark levels for a process (in such terms as percentage cost savings). However, I’d like to suggest that different KPI’s could be applied in different situations. (Note our earlier comment that the types of metrics being used to assess procurement at each stage are indeed a characteristic of how far along the organization is in its transformation!) Moreover, assessments provide a “baseline” of best practices that allows organizations to determine where they are today, where the biggest gaps are across their supply chain activities, and where are the opportunities. This roadmap can be used to develop a set of guidelines for deployment of best practices across an organization. The more important question is – what is the impact of procurement transformation on shareholder return – a metric that every CEO and CFO really care about!
What is Total Shareholder Return?
As defined by Wikipedia, Total shareholder return (TSR) (or simply total return) is a measure of the performance of different companies’ stocks and shares over time. It combines share price appreciation and dividends paid to show the total return to the shareholder expressed as an annualized percentage. It is calculated by the growth in capital from purchasing a share in the company assuming that the dividends are reinvested each time they are paid. This growth is expressed as a percentage as the compound annual growth rate.
In practice TSR is difficult to calculate since it involves knowing the price of the shares at the time the dividends are paid. However, as an approximation over one year it can be calculated as follows with:
Price_{begin}= share price at beginning of year,
Price_{end}= share price at end of year,
Dividends = dividends paid over year and
TSR = total shareholder return is computed as
TSR={(Price_{end}-Price_{begin}+Dividends)}/{Price_{begin}}}
Total Shareholder Return (TSR) is used as a measure of business success, and is impacted by a broad range of factors.
TSR is made up of two key components:
- The difference in company valuation between two periods in time (usually twelve months)
- This is heavily influenced by market conditions
- Market analysts also play their part by evaluating how well positioned they think the company is to perform within their respective markets
- Analysts are often influenced by financial statements showing the Cost of Goods Sold, as well as Net Revenue during this same period.
- The value of dividends paid during the same period.
- Making savings improves the bottom line
- Improving value and revenue grows the top line
Procurement does not influence all of these factors and there are many factors outside its control. However, given the pivotal role procurement plays between internal stakeholders and external suppliers makes its ideally positioned to reflect the broader organization. Shareholder return may vary based on many factors unrelated to procurement transformation. But let’s take a shot at trying to understand this further.
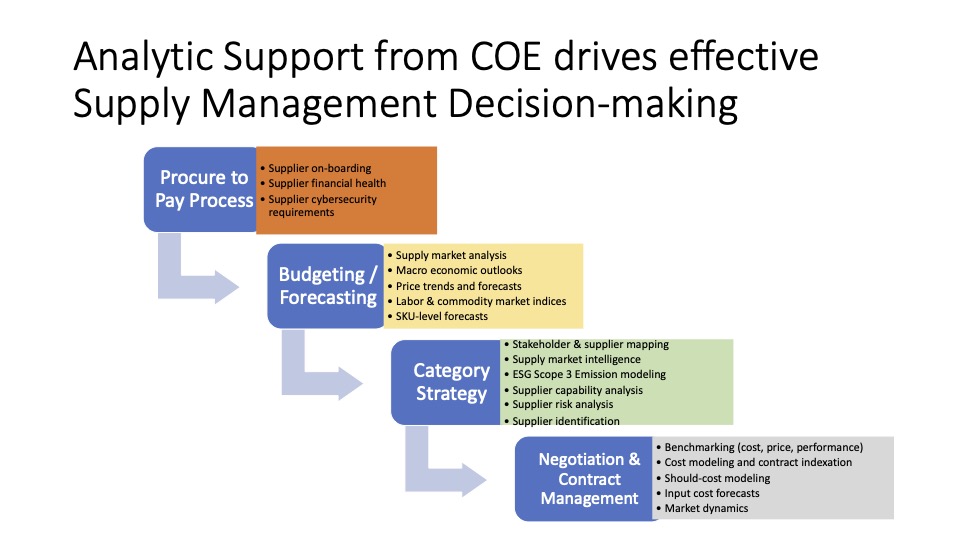
In the early stages of maturity, the primary objectives are to capture spend analysis, leading to price increases, which most directly impacts Cost of Goods Sold. As the organization matures, total delivered cost starts to provide improved customer performance, and impacts areas of indirect spend, which in turn improves sales revenue. Supplier innovation and improved market intelligence leads to better sourcing decisions, and category strategies are more closely linked to business unit and functional outcomes that drive overall organizational financial performance. Finally, the full spectrum of improvement in procurement impacts profitability and drives net income, which also improves TSR. This it the “hypothetical” view of how procurement maturity impacts TSR – but the reality is often not so simple.
What is the REAL Relationship of the PLTA to Total Shareholder Return?
While we would LIKE to see a simple linear relationship between an organization’s level of procurement maturity and its Total Shareholder Return, unfortunately this relationship is not so simple. This is because TSR is a function of many different environmental factors, that span many functional strategies outside of procurement. Some of these are shown in the Table below, which show the different financial parameters that can be influenced by decision made in each of the functional strategies that exist. It also emphasizes that even a highly mature sourcing function can see its shareholder return diminished by unproductive manufacturing, delivery or market factors, and service issues that are plaguing its supply chain.
So, as you see it isn’t easy to justify procurement based on Total Shareholder Return. While procurement can’t make the difference in a poorly defined business strategy, a lack of product innovation, or the “Uberization” of an industry, it is nevertheless an important business function that contributes value. Some of the more important parameters to consider include include working capital, impacting supply risk, Cost of Goods Sold, and in the end, supplier innovation that drive product revenue.
| Design | Source | Make |
| > Net present worth analysis to investment over a period – Interest accrued. > Comparing interest accrued/investment to revenue. > Product positioning – segment |
> Liabilities – Accounts Payable (Proportionate). > Cost Savings > Inventory levels > Procurement – Metrics – Cost of proc/TC of raw materials > Procurement ROI |
> Cap-Ex > COGS > Net operating profit/income >EBIT > Manufacturing cost as % revenue. > Revenue/employee. >ROCE |
| Market | Deliver | Service |
| >Inventory Turns > COGS > Revenue/Profit. > Accounts Receivable > Share price change> Mergers and acquisitions |
> Logistics cost.
> Returns > Warehouse ownership > E-commerce strategy
|
> % Change in sales > Revenue form spares > Inventory turns > Share Price |