SCRC Research contributes to the Wall St. Journal Top Companies of the Future
Once again, research by the Supply Chain Resource Cooperative was employed in developing the WSJ List of Best Companies for the Future. The methodology used scores from the Supply Chain Maturity Model to assess companies’ supply chain resilience, as well as their geopolitical risk and exposure. In this blog, I delve into some of the interesting insights developed by the AI platform that underlies the ratings, specific to supply chain future readiness.
Summary of Key Findings
| Consumer Companies Lead AI Adoption The top AI-in-supply-chain scores belong not to tech companies but to consumer giants: Amazon (4.90), P&G (4.89), Apple (4.88), Walmart (4.82), Coca-Cola (4.81). These companies have deployed AI across demand forecasting, inventory optimization, and supplier risk management at scale.This report presents the first comprehensive supply chain maturity assessment of the S&P 500, scored across the SCMM’s six dimensions and three thematic composites. Five headline findings emerge from the data: |
| The China Semiconductor Concentration 9 of the 10 companies with >30% China revenue are semiconductor firms. QUALCOMM derives 47% of revenue from China; KLA 43%; Applied Materials 39%. These companies represent critical nodes in the US-China technology competition. The Resilience Paradox Companies with moderate China exposure (5–30% revenue) score higher on supply chain resilience (4.05–4.06) than those with zero exposure (3.87). Managing complex geographies appears to force stronger supply chain practices. |
| Labor & Human Rights Is the Universal Weak Point The LHR dimension averages 3.49 across the S&P 500, a full 0.47 points below the next-lowest dimension (OPM at 3.83). Even top-ranked Apple scores just 3.71 on LHR. This represents the single largest improvement opportunity across the index. |
| Financials Trail by a Wide Margin The Financial sector averages 3.69 overall (vs. 3.85 index average), with 5 of the bottom 15 companies being insurers or financial services firms. Globe Life (2.56) is the lowest-scored company in the entire S&P 500. |
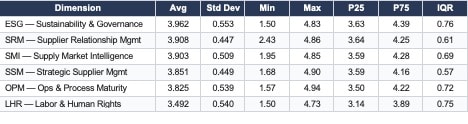
Overall Ratings Across Maturity Dimensions
LHR is the clear laggard, averaging 0.47 points below the next dimension. This reflects the broader challenge that labor practices in deep-tier supply chains (tier 2+) are difficult to audit and disclose. ESG leads because it benefits from the most robust regulatory disclosure requirements (SEC climate rules, EU CSRD).The high baseline performance in the ESG dimension is directly correlated with a legacy of intense regulatory pressure, though recent developments indicate a significant contraction in global disclosure mandates. The SEC adopted landmark rules for climate-related disclosures in March 2024, but facing legal challenges consolidated in the Eighth Circuit, voluntarily stayed the rules. By March 2025, the SEC formally voted to withdraw its defense entirely, creating an administratively incoherent posture where the rules are legally effective but practically dormant.
Simultaneously, the EU has significantly scaled back its sustainability reporting ambitions. The December 2025 Omnibus I package amended the CSRD by raising thresholds to companies with more than 1,000 employees and €450M+ turnover, removing an estimated 80% of previously scoped companies from mandatory reporting.
Sector Supply Chain Maturity Scores
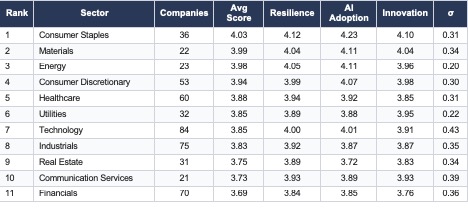
Consumer Staples leads the index — Companies like Coca-Cola (4.60), Walmart (4.51), P&G (4.47), and Colgate-Palmolive (4.46) have invested heavily in supply chain maturity improvements because their business models depend on it. Global distribution networks for physical goods demand operational excellence.
Technology has the widest spread (σ = 0.43) — This sector contains both the #1 company (Apple at 4.74) and several bottom-25 companies (Paycom at 2.64, Super Micro at 3.04). Hardware companies score much higher than pure-software firms because physical supply chains force maturity investment.
Energy shows remarkable consistency (σ = 0.20) — The tightest spread of any sector, likely reflecting standardized industry practices around safety, environmental compliance, and supplier management in extractive industries.
Financials trail significantly — At 3.69, Financials average 0.34 points below the index mean. Insurance companies are especially low (Globe Life 2.56, Everest Group 2.82, W.R. Berkley 2.92). Financial services firms often have limited physical supply chains, so SCMM dimensions like OPM and SSM score lower.
The pronounced underperformance of the Financials sector is largely due to the sector’s historical focus on financial capital resilience rather than physical goods distribution. However, financial institutions are currently undergoing a massive transformation regarding “operational resilience,” which functions as the financial sector’s equivalent to supply chain risk management. The Basel Committee on Banking Supervision (BCBS) catalyzed this shift with its Principles for Operational Resilience, mandating that institutions identify critical operations and map internal and external interconnections, including third-party dependency management.
In the UK, the PRA formalized these concepts into a strict operational resilience framework requiring in-scope financial firms to map important business services and conduct rigorous scenario testing by March 31, 2025. Regulators now demand dynamic, data-driven proof of resilience postures and active management of risks within deep-tier supply chains.
For insurance companies—which cluster heavily at the bottom of the SCMM rankings—supply chain maturity intersects uniquely with their core underwriting business through the vector of physical climate risk. When insurers withdraw coverage from highly exposed regions—creating “insurance deserts”—they trigger cascading supply chain shocks for manufacturing and logistics networks in those areas.
There are many more interesting relationships to be discovered in this remarkable platform. I will continue to provide insights on this blog.