Myths Regarding Impact of Tariffs’ Impact on the Global Economy Economy
or what to expect from Trump 2.0
With a new Trump administration coming into power in January 2025, one of the biggest fears that businesses are waiting to hear about is tariffs. President-elect Trump has offered that he will be instituting 10% tariffs on China, 25% on Mexico and Canada, and perhaps other tariffs, including on Korean products. He has stated that his intent is to increase the number of manufacturing jobs in the United States.
Unfortunately, there is a lot of misunderstanding regarding the effectiveness of tariffs to bring jobs back to America. There are many different economic studies that dispute this position. This article was written i with Professor Jason Miller at Michigan State University, addresses the five myths that are most passed around. These are likely common knowledge to many, but you would be surprised…
Myth 1: Tariffs are paid by the county importing goods into the US.
Truth: Tariffs are paid by U.S. consumers. Studies show that there was a full tariff pass through for the Chinese tariffs. In other words, consumers paid the full price of the goods, as the price increases resulting from tariffs were collected by Customs and Border Patrol and passed on as higher prices. Other research shows that antidumping tariffs have also proven to be generally ineffective.

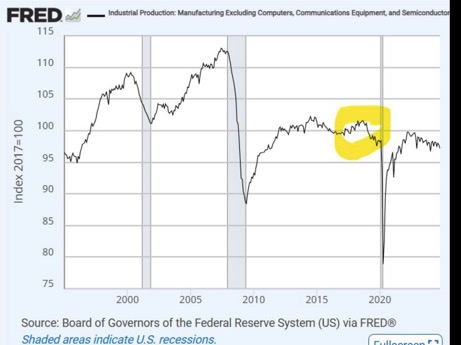
As Jason Miller, an academic at Michigan State University writes, it is important to set the record straight that U.S. manufacturing output actually fell in 2019 when the first round of tariffs were issued by Trump. Below is a plot he produced of manufacturing output excluding hi-tech products like computers (which don’t contribute much freight and inflate total industrial figures due to how inflation adjusted output is measured [compare inflation adjusted output https://lnkd.in/gerNRsJM versus value of shipments https://lnkd.in/g3djyBib and you will see the difference]). Permanent link https://lnkd.in/gkUBVZrY. Several points are obvious;
• 2019 is circled, where we saw a sharp decline in industrial production. This was widespread across industries such as machinery (https://lnkd.in/gecu_Tg4), fabricated metals (https://lnkd.in/gpcbd_TV), primary metals (https://lnkd.in/gAWwYRGP), wood products (https://lnkd.in/ge2g8gjb), and even furniture (https://lnkd.in/gKvtxyZv).
• Many of the sectors cited above as having declining output in 2019 were the exact goods protected by the 2018-2019 tariffs (e.g., Chinese furniture per The Wall Street Journal https://lnkd.in/gnMpmpCT).
•Notice two periods of strong growth in manufacturing: 1996-2000 and then 2003 – 2007. Those periods were AFTER trade liberalization via NAFTA (1994) and China (2000).
Implication: while it’s important to present all possible arguments for and against imposing widespread tariffs, facts matter. No one can look at these data for manufacturing output and say that the 2018-2019 tariffs have increased U.S. manufacturing activity.
Myth 2: Tariffs protect manufacturing jobs in the United States
Truth: Tariffs can hurt manufacturing jobs. Economic studies show that there are no employment gains in manufacturing sectors that received tariff protection, but sectors that were targeted for retaliation by shed jobs (because their exports dropped). Examples include American produced soybeans, poultry, beef, metal production, business services, vehicles, and others. In the case of washing machines, while these tariffs did result in the creation of ~2,000 final assembly jobs in the U.S., the estimated additional costs consumers paid for buying washing machines and dryers (which saw their prices increased despite not being tariffed) amounted to ~$817,000 per job.
Myth 3: Tariffs are good for US Exports
Truth: Tariffs Harm US Exports In today’s complex global supply chains, a small number of U.S. manufacturing firms that also have plants overseas account for a disproportionate share of imports made by US manufacturing firms, and also receive significant exports from US firms. There is also strong evidence that countries that have seen increased exports to the US have done so by heavily increasing Chinese imports.
Further, tariffs hurt export growth. Many US manufacturers buy a lot of their components and inputs from China. Evidence shows that manufacturing industries that saw tariffs drive up their input costs or were targeted for foreign retaliation shed jobs. U.S. manufacturing firms that saw the largest increase in tariffs on imported components displayed lower export growth.
Myth 4: Trade liberalization leads to lost American jobs
Truth: Trade liberalization leads to more America jobs. Economists report that the jobs created through greater exports stemming from trade liberalization more than outweighed jobs lost due to competition. Evidence also shows that one-third of the reported decline in manufacturing employment in response to trade liberalization was due to establishments changing industries (a subtle issue not adequately discussed).
Myth 5: Without tariffs, we will not be able to manufacture anything in the U.S.
Truth: The US will manufacture the products they excel in already. Economists report that trade liberalization with China created winners and losers, with most of the job loss stemming from large U.S. firms either closing plants or stopping manufacturing at facilities and shifting to wholesaling or research and development. They further report job loss due to trade liberalization was not driven by closure of firms. Also, studies show that trade is incredibly concentrated amongst a small number of firms that pay the best wages and are the most productive.
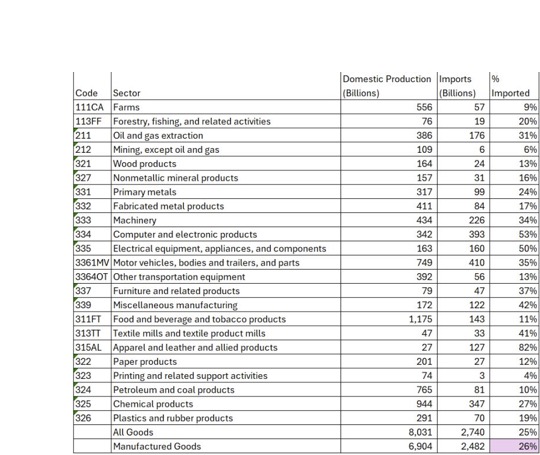
Perhaps the tariff question I’ve been asked about the most is “what are the inflationary impacts of a 60% China and 10-20% rest of world (ROW) tariff?” Answering that question is challenging, but the Bureau of Economic Analysis does provide us some useful tools in the form of the Supply Tables from the Input-Output Accounts (https://lnkd.in/eQdPji9). One table below from the 71-industry breakout for 2023. Thoughts:
•The table shown below reports domestic production as well as imports based for commodities on what the BEA terms “basic prices” to make them comparable. The sum of domestic production and imports represents what the BEA calls “total product supply”. I’ve isolated sectors with physical goods like agriculture products; forestry, fishing, etc.; mining, crude oil and natural gas extraction; and all parts of manufacturing.
•Jason calculated the percentage of the total product supply that is imported for each commodity type. Figures range at the high end of 82% for Apparel & Leather Products (NAICS 315 & 316) and 53% for Computers & Electronic Products (NAICS 334) to lows of 4% for Printing (NAICS 323) and 11% for Food, Beverage, & Tobacco (NAICS 311 & 312).
•Whether looking at all goods or just manufactured goods, the figure we arrive at is ~25% of total product supply is imported.
•Consequently, a 10% universal tariff represents a 2.5% cost shock to goods; this will be made worse because many manufacturers will respond to receiving tariff protection by raising their own prices—something previously reported in peer reviewed research (https://lnkd.in/gdTYqjDp).
Implication from Jason’s analysis: the BEA’s Input-Output Account data provide a good sense of the magnitude of cost shock that goods will experience with universal tariffs. One challenge with looking at costs alone is that markups also need considered, and we don’t fully know how wholesalers and retailers will respond. Regardless though, this table is prima facie evidence that universal tariffs will be inflationary for goods. Anyone who is telling you otherwise either has a political motive or doesn’t understand basic economics.

President Trump just announced he will place 25% tariffs on all goods from Mexico and Canada on Jan 20 (https://lnkd.in/gK2y3cBk). Consequently, I wanted to get data published tonight on the most affected types of goods (data sourced for 2023 from https://lnkd.in/gVJUngtW at the NAICS6 level). Below I’ve compiled total imports from Canada and Mexico at the 6-digit NAICS level for 2023 and included the share of total imports this represents. One table. Thoughts:
•The motor vehicle sector is disproportionately affected, with over $200 billion in imports affected. Those imports will now cost importers $250 billion. As dealer margins have fallen back to pre-COVID levels (https://lnkd.in/gcNxAwXk), this means that dealers won’t be in a position to absorb higher costs. Consequently, this will cause inflation in motor vehicle prices, and potentially drive down sales as a result.
•70% of crude oil imports come from Mexico and especially Canada. As the EIA estimates 52.6% of the price of gasoline is due to crude oil, this suggests a 0.70 * 0.526 = ~37% increase in gasoline prices for gasoline made from imported crude oil.
•Other key imports are electronic products, various foods (though it’s important to remember the vast majority of food consumed in the U.S. is produced domestically), primary metals, and lumber. Soft lumber from Canada is a big input into the housing industry…. and so are appliances from Mexico – which would not bode well for housing prices, and would certainly worsen the current housing shortage.
Implication: If implemented across all goods from Mexico and Canada (and setting aside the increased tariffs on Chinese products), tariffs will be inflationary. Thus, cutting interest rates could be dicey, because the risk on inflation and employment concerns. On the other hand, Trump is sort of a transactional guy, as shown by his goading of Canadian Prime Minister Trudeau as “Governor” (of the 51st state). He may be playing his hand.


