Designing a Test Kit Supply Chain in Response to COVID-19

Summary of sponsored research conducted through NC State University’s Supply Chain Resource Cooperative (SCRC), July 2020 – August 2021
Background and Introduction
In the summer of 2020, as the COVID-19 pandemic continued to wreak havoc on public health systems across the United States, the National Institute for Innovation in Manufacturing Biopharmaceutical (NIIMBL), in partnership with the National Institute of Standards and Technology (NIST) of the U.S. Department of Commerce, awarded a $595,000 grant to a team of researchers affiliated with Poole College’s Supply Chain Resource Cooperative (SCRC). The team undertook a comprehensive study of the supply chain for COVID-19 testing. The formal duration of the project was July 1, 2020 through August 15, 2021.
The project team consisted of the following individuals:
- Principal Investigator: Rob Handfield, Ph.D., Bank of America University Distinguished Professor of Operations and Supply Chain Management at NC State
- Co-Investigator: Don Warsing, Ph.D., Associate Professor of Operations and Supply Chain Management at NC State
- A team of project consultants:
- Richard Kouri, Ph.D., Professor of the Practice of Plant and Microbial Biology at NC State
- Hadi Moheb Alizadeh Gashti, Ph.D.
- Sajjad Taghiyeh, Ph.D.
- Nikhil Singh, M.S.
- Beena Thomas, MBA, Ph.D.
- Isha Singh, M.S.
- Elwin Carl Pinto, M.S.
- Ankita Pundir, M.S.
- Mayur Patil, M.S.
The consultant team — except for Professor Kouri, who has long-standing faculty affiliations with NC State — were all either recent graduates from NC State, or students during the time they worked on the project, some of whom volunteered their time, based on their research interests in supply chain.
Since March 2020, when the World Health Organization declared SARS-CoV-2 (novel coronavirus) infections to constitute a global pandemic, and until COVID-19 vaccines first became available in January 2021, one of the most important tools in combating the spread of the virus was testing for the presence of the virus in individuals. The first widespread push to deploy testing was based on technologies that required materials that were established by the CDC, but in short supply. In addition, processing capacity bottlenecks at testing laboratories caused them to be overwhelmed with more work than they could handle, and test turnaround times for test results kept climbing from five to six days, or more. Complexities associated with manufacturing, availability (of raw materials and finished test kits), and accessories led to supply chain shortages that resulted in long testing lead times, especially for PCR tests. Shortages also occurred due to CDC approval of kits that had severe supply chain bottlenecks and single source requirements.
The NC State research team took the approach to break this wide-ranging endeavor into three targeted research threads:
- Understanding the nature of demand for Covid-19 testing
- Supply availability of test kits and their components
- Strategies for optimizing screening protocols and test kit distribution.
The following sections describe the research activities that supported the above research areas.
Understanding the nature of demand for COVID-19 testing
Supported by reviews of prior research and the team’s own analysis, the SCRC researchers reasoned that testing and isolation based on COVID-19 symptoms alone would not be sufficient to control the spread of the SARS-CoV-2 virus. Effective suppression depends critically on testing asymptomatic individuals as part of a comprehensive strategy. Throughout the first months of the pandemic in the U.S., however, testing was limited to the diagnosis of symptomatic individuals. Confirmation that symptomatic individuals are infected by the SARS-CoV-2 virus is done most accurately by using nucleic acid-based tests such as those that require analysis that uses a laboratory technique called polymerase chain reaction, or PCR. These tests, however, are quite expensive (~$100), require special laboratory resources, and have processing times, from sample collection to the reporting of the results, of at least 24 hours to two days or more, depending on the availability of lab processing capacity.
Alternatives to diagnostic testing of symptomatic individuals are screening testing, (intended to identify infected people who may be asymptomatic), and surveillance testing, (which involves the systematic collection, analysis, and interpretation of testing outcomes for ongoing public health reporting). The remainder of this section describes the team’s support for recommending the extensive use of screening testing to help suppress the spread of COVID-19. A complete overview of the team’s related research is summarized and documented in a team-authored working paper.
As surveillance testing is typically performed on de-identified specimens, this makes it difficult to use the results for individual decision-making. The SCRC team’s research led to the conclusion that screening testing of asymptomatic individuals in order to detect those who are likely infectious has been underutilized throughout the course of the COVID-19 pandemic. An important supply chain-related benefit of screening testing is that it allows a more direct estimate of the number of tests needed in any given region, as it is based on planned screening protocols to be deployed in specific locations. This is in contrast to PCR-based diagnostic testing of only symptomatic individuals, which is driven by the highly uncertain and hard-to-predict incidence of symptomatic cases and the additional uncertainty regarding whether, and where, symptomatic individuals will seek out a test.
In contrast, screening via antigen tests — also called point-of-care tests or rapid-response tests — costs as little as $5 per test for antigen kits purchased in bulk and provides results in 30 minutes or less. The kits also include codes that can be used to share the test results digitally with public health agencies. Antigen tests do, however, suffer from low analytical sensitivity, meaning that they require greater amounts of viral material to register a positive detection of COVID-19. This means that these tests may be less capable of accurately registering a “true positive” than a more sensitive testing method, such as lab-based PCR. The lower sensitivity of antigen test kits resulted in hesitancy in using them at the outset of the COVID-19 pandemic. Lower sensitivity, however, can be overcome by increasing the frequency of testing. For example, a test that is 85% sensitive has a 15% chance (100% – 85%) of failing to detect someone who actually is infectious, or a “false negative,” but a negative result in each of two, back-to-back applications of this test indicates only a 2.25% chance of a false negative (given by 15% × 15%), effectively raising the sensitivity to approximately 98%. Moreover, the antibodies used on antigen test cards to detect the presence of SARS-CoV-2 are directed at the proteins that are not variant-specific, allowing them to be used effectively even as the SARS-CoV-2 virus continues to mutate.
The team determined that widespread deployment of antigen tests (i.e., point-of-care, rapid tests) for screening at key congregate settings (e.g., schools, large business facilities) would be highly effective for both supply planning and protecting public health. Antigen test-based screening simultaneously achieves positive public health outcomes by identifying infected individuals, perhaps even before they show symptoms, while also allowing a clear definition of demand for tests. By contrast, not only is the demand for symptom-driven collection of samples to be processed via PCR highly uncertain and difficult to predict, but the delay in producing the test results leaves the public potentially exposed to virus spread while infected individuals await their results and continue to go about their business. Of course, in the broader testing environment, extensive screening via antigen tests would coexist along with PCR testing for symptomatic individuals and/or those who are able to wait in isolation for lab results.
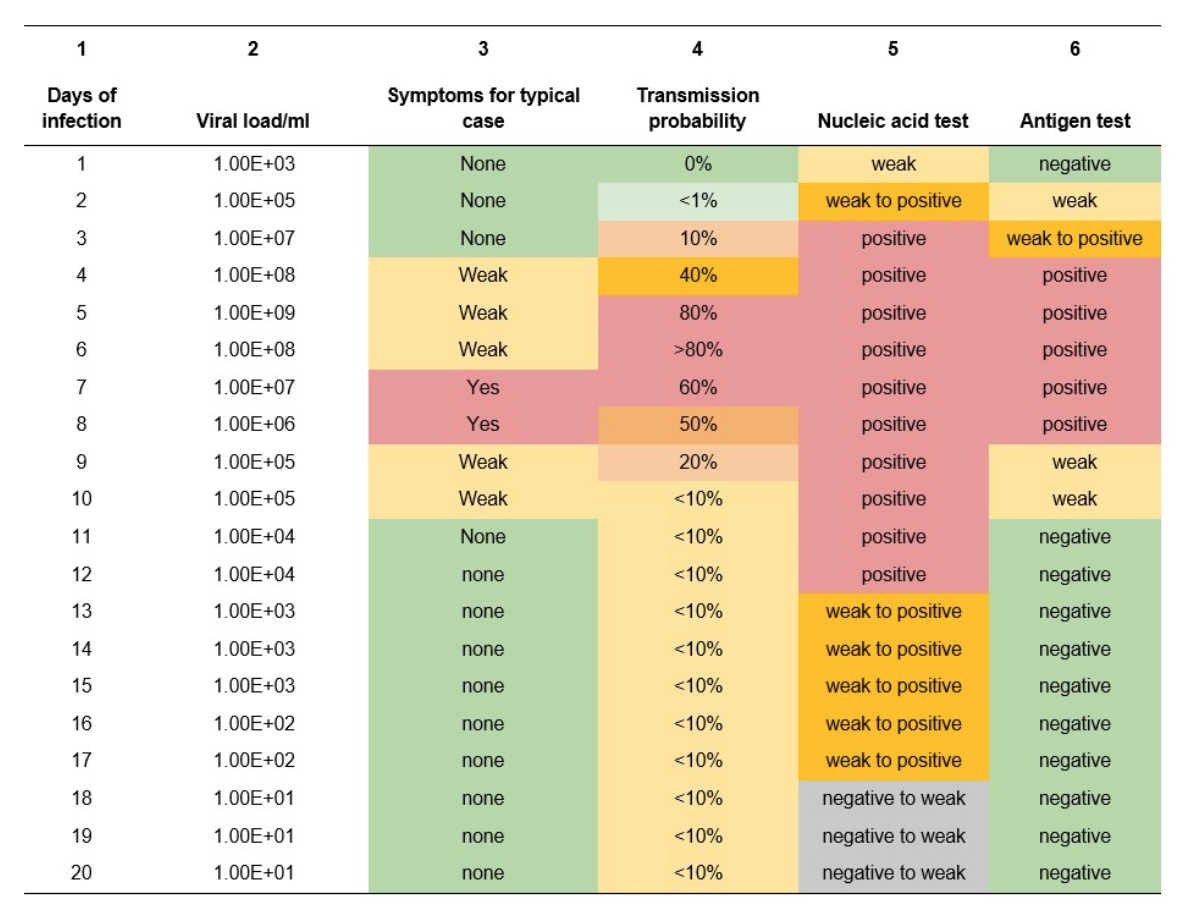
To begin with, the team conducted a meta-analysis of published research comparing clinical study results which is summarized in Table 1 below. Columns 1-5 of Table 1 show the typical daily rates of viral growth in the nasal passages of individuals infected with the SARS-CoV-2 virus (as measured by qPCR), the level of symptoms, and the probability of disease transmission during these time intervals. The broad implication of this meta-analysis is that antigen tests appear to detect the virus in what could be described as a “Goldilocks” zone, which is the period when an infected individual is most likely to be infectious (i.e., 4-7 days post infection; see Table 1, column 3). It is also noteworthy that antigen tests revert to identification of weak or negative results once the individual’s immune system is actively killing the virus and the risk of transmission is low. Thus, deployment of antigen tests in screening individuals at specific locations — say, important congregate settings like schools, long-term care facilities, correctional facilities, or large business settings such as factories or office complexes — appears to be an effective means of identifying and isolating infected individuals while also allowing the safe continuation of productive activities. To account for the higher viral loads (100-1000 fold higher) for the Delta variant, the results should consider both symptomology and transmissibility to occur 24-48 hours earlier than shown in this table.
Table 1 — Meta-analysis of clinical study results for COVID-19 tests
As a means of computing the requirements for antigen test kits in specific screening settings, and the associated costs of procuring the required kits, the SCRC research team adapted the analytical model proposed by Paltiel et al. (2020) in an article published in JAMA Network Open. The method employed by Paltiel et al. is based on a widely used model in epidemiology, the SEIR model, which determines, over time, the number of individuals in a closed setting that are Susceptible to infection, Exposed, Infected, or Recovered. This model is applicable to any infectious disease, including COVID-19. Paltiel et al. based their analysis on opening college campuses for the Fall 2020 semester, which is a setting similar to those listed above, but more in line with surveillance testing. The SCRC team first accessed the R code written by an independent research team at the University of Wisconsin to replicate the Paltiel et al. results and subsequently adapted the code to incorporate additional parameters relevant to specific screening settings.
The modified R code is made publicly available at the SCRC dashboard to any interested individual who wishes to further investigate the cost and performance of antigen test-based screening protocols across a horizon of a specified number of weeks, employing specific choices of testing frequencies in the first weeks of this horizon, possibly employing the same or a different frequency in the remaining weeks of the overall testing horizon. Similar to the Paltiel et al. model, this model also allows for “exogenous shocks” to the testing pool, meaning new infections are introduced to the system at some regular rate — which reflects, for example, the possibility that some individuals may, between visits to the congregate setting in question, participate in activities (e.g., large gatherings like parties or weddings) that may dramatically increase their probability of introducing new infections that need to be identified and screened out of entry.
Finally, as a means of providing ongoing tracking of actual demand for COVID-19 testing, the SCRC team developed several visualizations in additional dashboards that provide detailed information regarding reported testing rates across the U.S., the supply capacity of test kit providers and PCR processing labs, and the status of vaccinations. We note from the testing dashboard that the number of tests carried out in the U.S. continued to increase until December 2020, and then has declined as the number of vaccinations increased and number of COVID cases continued to shrink. With the fourth wave of the pandemic in mid-2021, testing capacity was again becoming constrained in hot spots across cities and states alike, which supports the need for test kit allocation strategies along the lines as described in this set of research threads.
Supply availability of test kits and their components
Broadly, the goals of SCRC team’s project were to better understand, analyze, and model the relevant supply chains for test kits and supporting materials, and to more accurately inform the relevant technical, public health, and public policy communities on the means of ensuring a reliable supply of testing materials for monitoring the course of the COVID pandemic. This required an in-depth differentiation of the variety of tests (antibody, antigen, nucleic acid) for building an effective testing strategy, and a coordinated set of trusted metrics to guide a national testing policy.
As the summer of 2021 demonstrated, COVID testing remains important as variants continue to emerge, and cases will likely continue for the next several years or longer within the U.S. if the disease becomes endemic. An inability to test the population rapidly and effectively obscures the true scope of the pandemic, prevents an effective coordinated response, results in tremendous loss of life, and significantly impacts economic activity. As stated by the House Energy & Commerce Subcommittee chairman Diana DeGette, “If we’re going to give the American public confidence so they can resume familiar activities and safely return to work, we need to expand testing to more people, including asymptomatic people.”
Over the course of the COVID-19 pandemic, the SCRC research team continued to monitor the availability of test kits, and continued to explore the challenges with availability of components and material inputs within the testing supply chain. The team began by describing the end-to-end process map for the testing process, and identified the current elements associated with this process. It became clear to the team that the supply and distribution of test kits in the midst of a pandemic in the United States was not an easily defined problem, due to shifting bottlenecks throughout a supply chain that was being developed as it was simultaneously being deployed. Initially a large number of test kits were developed by various manufacturers and authorized for use under FDA’s Emergency Use Authorization, but this quickly generated its own set of supply chain challenges for production scalability, inherent limitations of test results (false positives/negatives), procurement, and finally, distribution.
As an increasing number of laboratories developed commercially available kits during the period of June – September 2020, however, soon limited availability of specimen collection supplies and various laboratory reagents began to constrain the testing supply chain, which then became a limiting factor for making policy decisions regarding reopening the U.S. economy. To better understand the nature of the supply problems across the testing supply chain, the SCRC team conducted interviews with multiple stakeholders May – August, 2020. The interviews revealed a number of insights into the nature of the constraints in the COVID testing supply chain, most prominently shortages of plastic consumables and laboratory chemicals, as well as the inability of commercial laboratory equipment manufacturers to keep up with demand. In some cases, government restrictions and allocations hampered access to critical testing supplies and laboratory equipment. The SCRC team’s interviews captured insights from a group that represented over 80% of COVID-installed testing capacity during the period of March – June 2020 The interview summary, available separately, provides more in-depth discussion of related insights from the interviews.
Another important outcome of the interviews was the identification of a group of keywords that the research team used as the basis for an in-depth analysis of two sources of possible early warnings of pending shortages in the testing supply chain. Those two sources were Google and Twitter. Machine learning code was developed by the team to execute Google searches for various collections of terms related to shortages and bottlenecks in the COVID testing supply chain, and the results were compiled in an extensive database, from which the team extracted statistics on the number of mentions of specific combinations of shortage-related terms by week from January 2020 through March 2021. In parallel, the team used the Brandwatch database to build a database of Twitter tweets, and associated data that categorizes tweets by “sentiment” and “emotion”.
The team’s goal was to develop a statistical model that relates the timing of public statements of shortages and bottlenecks in the COVID testing supply chain to shortages of specific items at specific points in the supply chain. The team’s hypothesis is that Google “hits” for COVID shortage-related searches and Twitter tweets about COVID-related shortages can serve as a sort of “canary in the coalmine” signal of upcoming, widespread shortages across the supply chain being predicted by these early warnings. While the team struggled to find a verifiable source of shortage data, they were able to uncover a publicly available website article from Premier group, a group purchasing organization (GPO) providing aggregated procurement contracts and analytics in healthcare supply markets. The SCRC team focused on the trends in reported shortages of pipette tips — an important laboratory component consumed in PCR testing for COVID — among Premier’s customers, as reported in the article.
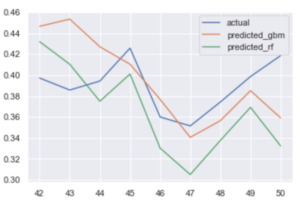
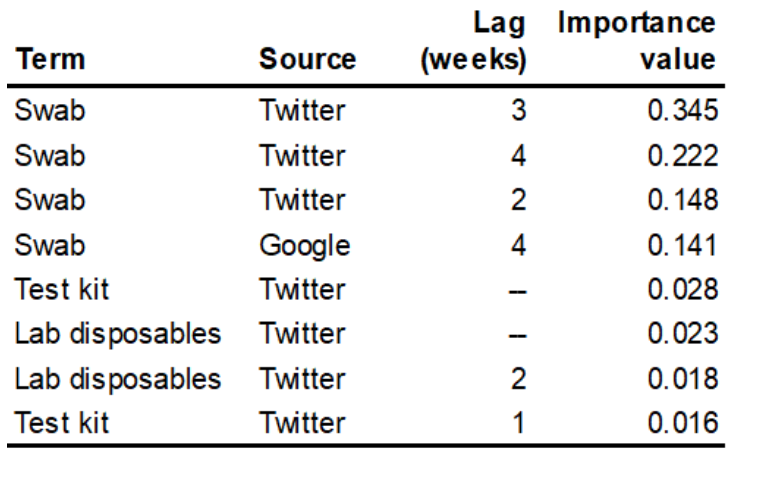
The team used machine learning algorithms to sift through the presumed predictors, specifically the counts of search hits and tweets, including time lags in the search and tweet data of up to four weeks prior to the week of the reported pipette shortage, along with reported “sentiment” and “emotion” data on the tweets. The preliminary results of the analysis show that publicly accessible data harvested from internet searches, particularly from Twitter, can indeed be used as an early warning of COVID testing-related shortages. Results are displayed in Figure 3, which shows the predicted pipette shortages in the final nine weeks of the data (weeks 42 – 50 of calendar year 2020) using both gradient boosting machine (GBM) and random forest (RF) methods. Between these two, RF produces the model that is a better fit to the actual shortage data. The predicting variables that have the highest weight in the resulting model are listed in Table 2. The importance factors listed in Table 2 effectively describe the percentage of the explanatory power of the model that is captured by that predictor in the model. Thus, Table 2 indicates that over 85% of the variance in pipette shortages, as reported by Premier group, is explained by Twitter tweets and Google search hits for COVID testing swabs from 2 – 4 weeks prior to a given week’s pipette shortage.
Figure 3 — Actual and predicted pipette shortages at the end of 2020
Table 2 — Importance values for pipette shortages predictors in RF model
Strategies for optimizing screening protocols and antigen test kit distribution
Building on the initial work regarding the analysis of test-driven screening protocols recommended for congregate settings, the team also developed a means of searching for protocols that result in optimal outcomes. A multi-objective simulated annealing (MOSA) algorithm was developed for protocol optimization, based on a set of three objectives: (1) minimizing the cost of tests, (2) minimizing the total number of infections that ultimately develop over the testing horizon, and — given the ongoing concern with antigen test kit sensitivity — (3) minimizing the number of false negatives. In addition, the team’s MOSA code can also, if desired, constrain the solutions to limit the maximum number of individuals in isolation (i.e., positive test outcomes) across the horizon. The protocol optimization is solved for a given population, for example all of the students and staff in all K-12 schools in a given U.S. county, which is something that can be determined using data gathered from the Brown University School of Public Health. The MOSA algorithm actually generates a collection of solutions that represent the best tradeoffs among the three objectives. The team also extended the protocol optimization problem to cover not just a single, isolated county, but also regional collections of counties. In this multi-county setting, the optimization of the testing protocol can be solved in two ways: generating either independent optimal protocols across the individual counties or a single, optimal protocol covering all counties in the region.
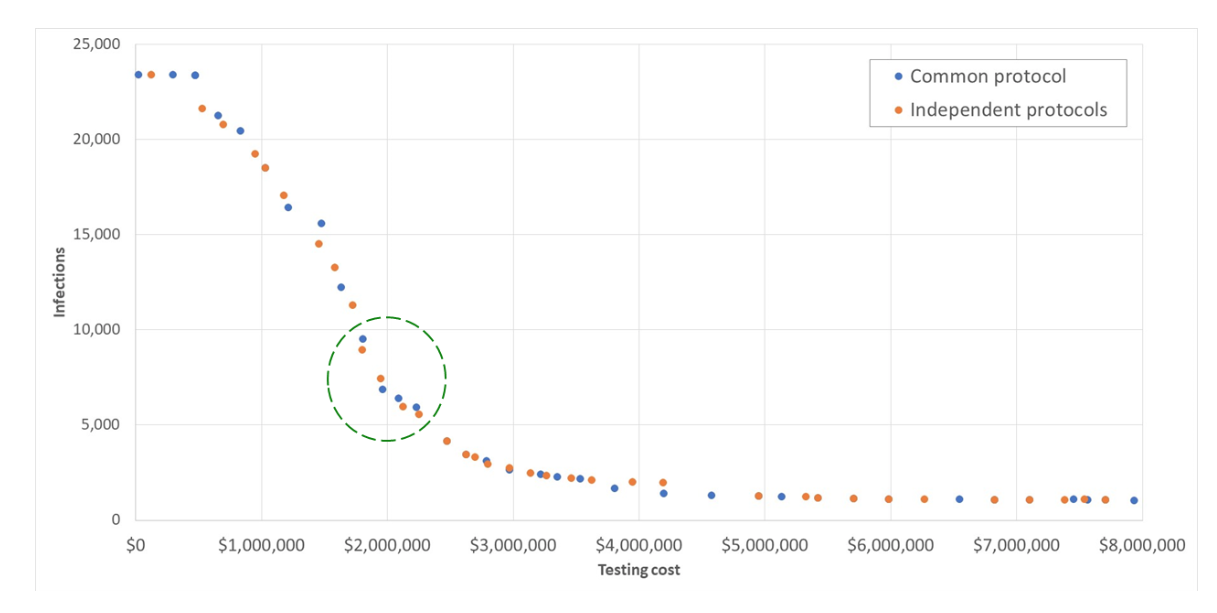
Figure 4 — Cost-infection tradeoff for Alamance County, NC (within a 10-county cluster)
Examples of the cost-versus-infections tradeoffs in the sets of solutions from these two different approaches to solving the problem, as applied to a 10-county cluster in central North Carolina, are shown in Figure 4. These results shown are for Alamance County, NC, which has, per the Brown University data listed above, a total student and staff population of 24,745 individuals across all K-12 schools. The 10-county cluster that was solved covers Alamance, Caswell, Chatham, Durham, Granville, Harnett, Lee, Orange, Person, and Wake counties, with a total K-12 student and staff population of 313,277 individuals. The total student and staff population across all K-12 schools in North Carolina is 1.53 million individuals. The solution assumed that 5% of that population was initially infected in the SEIR model used to compute the trajectory of the infections across a 16-week testing horizon.
In Table 3, we show the details for the solutions that appear in the circled area in Figure 2. These solutions, appearing at the “down-slope” inflection point of the graph represent what might be viewed as a “sweetspot” of potential protocol choices, those that provide what appears to be a reasonable tradeoff between infections and cost, providing a public health decision maker with some choices to weigh regarding how to balance the competing objectives. Table 3 also shows the values of the other objective, false negatives, and the outcome that can also be constrained by the code (but was not in these solutions), maximum number of individuals in isolation.
Table 3 — Selected 10-county cluster solution details for Alamance County, NC

Building on the approach described above, the team extended the optimization problem to optimally locate a set of p (= 1, 2, …) strategic stockpiles to distribute boxes of test kits at the minimum total priority-weighted freight cost. In this extended formulation of the problem, the relative priority weighting of the distribution for a given county is determined by the intensity of the pandemic in that county relative to the rest of the counties in the state.
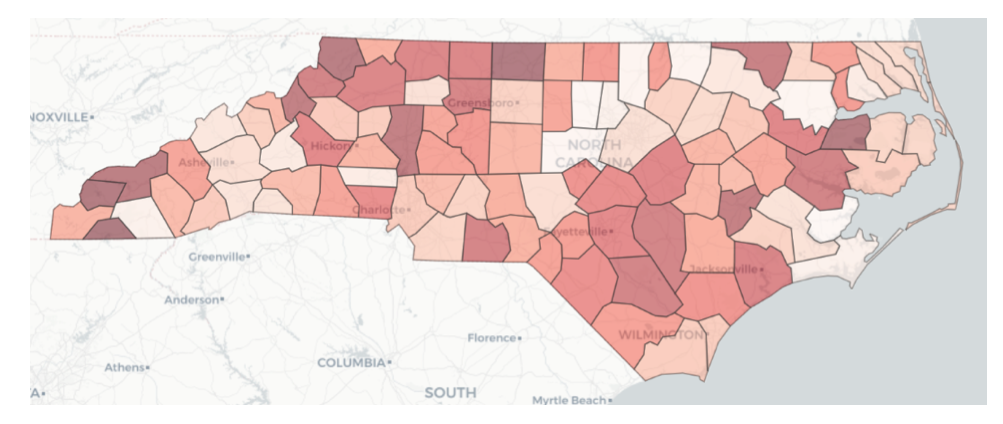
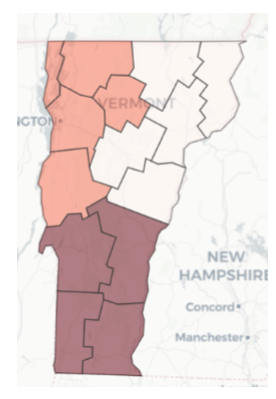
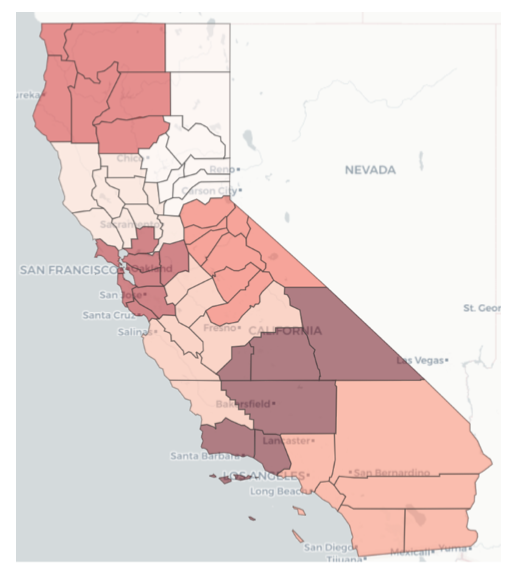
To determine the relative intensity of the COVID-19 pandemic across all counties in a given state in the U.S., the team employed a combination of two methods. The first is the Technique for Order of Preference by Similarity to Ideal Solution (TOPSIS), first introduced by Hwang and Yoon (1981). TOPSIS generates an overall priority weighting among multiple measures by finding weights that result in the minimum geometric distance from an ideal solution. The other method is via predictive analytics, whereby the research team created a machine learning model to predict two measures that reflect pandemic intensity, namely the number of COVID-19 cases and the number of deaths resulting from COVID-19. A large number of possible predictors were fed into these machine learning models, but ultimately, the most important were average COVID cases per capita, average COVID-related deaths per capita, COVID transmission rate, ratio of population fully vaccinated, and incidence of diabetes. Accordingly, the TOPSIS model used average COVID cases per capita, average COVID-related deaths per capita, and ratio of population fully vaccinated as its input measures. County prioritization maps for data through July 10, 2021 are shown for NC, VT, and CA in Figures 5, 6, and 7. In these plots, the darker shaded counties are those with higher priority relative to other counties — meaning higher intensity of the COVID pandemic, as reflected by the weighted average of the case and death predictions and the TOPSIS ranking. The data supporting this analysis is drawn from a team-developed data lake supported by data collected daily from several sources, including Covid Act Now and Google. The team also developed a supporting Jupyter notebook that executes queries against this data lake.
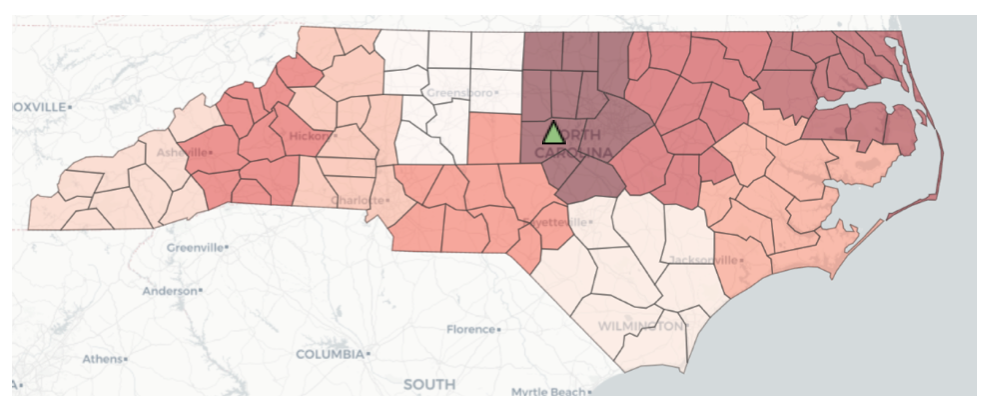
Due to the scope and size of the joint protocol-location optimization problem, the team had to limit the size of the regions in order to solve them within a reasonable time frame. Accordingly, the team incorporated a routine to achieve the prioritized county clustering implied by the initial discussion in this section above. This routine creates clusters containing a target number of counties and then displays the relative priority levels of the clusters by averaging the priority measures across the counties in the cluster. Cluster maps for NC, VT, and CA are shown in Figures 8, 9, and 10.
Figure 5 — Relative intensity of COVID pandemic across NC counties
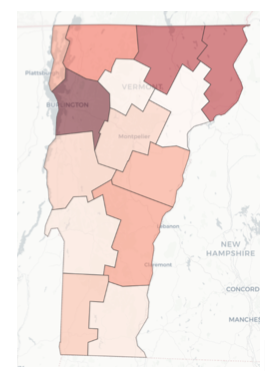
Figure 6 — Relative intensity of COVID pandemic across VT counties
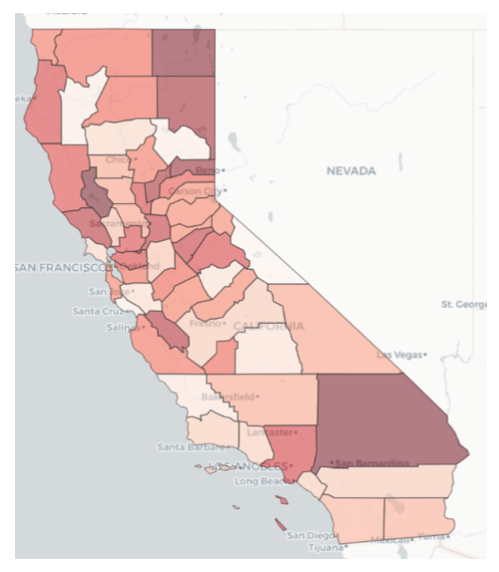
Figure 7 — Relative intensity of COVID pandemic across CA counties
Figure 8 — Relative intensity of COVID pandemic across NC county clusters (with optimal stockpile location shown in Chatham County)
Figure 9 — Relative intensity of COVID pandemic across VT county clusters
Figure 10 — Relative intensity of COVID pandemic across CA county clusters
As of this writing, the team is continuing to develop the code to solve for the optimal location of storage and distribution points — i.e., the “strategic stockpiles” — within a given county cluster. A sample solution to locate a single distribution point (p = 1) in the highest priority cluster in NC, per the priority data from July 10, 2021, identified Chatham county as the optimal location, as shown by the green triangle on the map in Figure 8. Solutions for larger values of p, and a procedure to efficiently determine the optimal value of p for any given cluster, are being developed by the team.
In addition, complete working papers that describe the technical details behind the procedures described above — county-level prioritization, the testing protocol optimization, and the joint protocol-location optimization — are in progress. Links to these papers will be provided when they become available. Upon request the authors will provide the code to the models developed for the analysis.
Going forward
The work of the SCRC research team provided insights into some of the major trends and assumptions about the use of test kits and the COVID-19 pandemic: a) what we know about this virus and likelihood of resurgence, b) how much testing and what the demand for test kits looked like, c) the critical bottlenecks in testing kit supplies that emerged, and the different activities and bottlenecks that emerged, and how they were resolved.
Readers are encouraged to follow the SCRC COVID testing blog to learn about important insights that the research team believes will be important as we enter a post-COVID economy, and the important role of testing going forward.
Recommendations for testing in the near future include the following:
- Develop standards for the collection and visibility of validated testing data
- Create visibility into manufacturing/availability of test kits, testing capacity and invest in re-shoring critical resources
- Maximize laboratory capacity through equipment diversification strategies
- Scale up production of alternative reagents and testing components
- Scale up production of rapid antigen tests in conjunction with PCR testing
The work of the SCRC team is not only a look back on the COVID crisis and what we learned, but a look forward that assesses what will be required in the future to combat COVID or a similar pandemic. We will continue this journey as we seek on-going funding for global testing solutions for an on-going COVID pandemic that is likely to continue for some years to come.
